Equity Gaps Facing African American Students

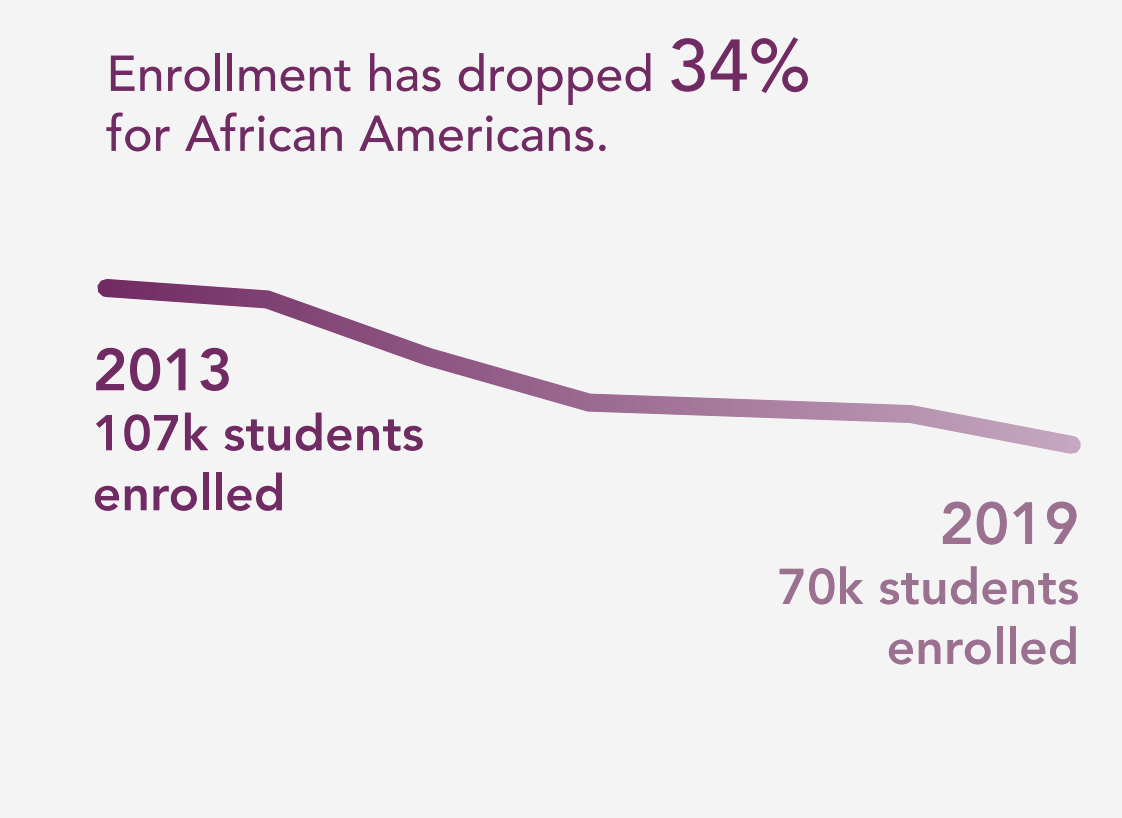
Enrollment has dropped 34% for African Americans. Undergraduate enrollment in all sectors of higher education has declined by 19.4% between 2013 and 2019. Enrollment for white students has dropped by 25.9% overall, while it has dropped disproportionately for African Americans, even before the impact of COVID-19. In 2019 there were just over 70,000 African Americans enrolled in Illinois colleges and universities, down from 107,000 in 2013. And the proportion of the student population that is African American has declined every year from 14.7% to 12.2%, even though the percent of the state population that is African American has stayed steady.3
African American first-year students are placed in developmental education at higher rates than white students. At public universities, 15% of African Americans are placed in non-credit developmental education compared to 5% of whites, while in community colleges, 65% of African Americans and 40% of white students are. There is even a gap in the number of credit hours African American and white students accumulate when placed in math developmental education at public universities, with African American full-time freshmen accumulating only 8.4 credit hours in the first semester, while white students accumulate 10.6 on average. One would expect full-time students to accumulate at least 12 credit hours in a term, and 15 hours to stay on track to graduate in four years.
Even earlier in their education career, African Americans have less access to Advanced Placement (AP) and dual credit early college experiences. As a result, they miss out on the opportunity to earn credits or get exposure to college-level work. African Americans made up 15% of the high school graduating class in 2018. Yet, of the seniors enrolled in dual credit, only 9% are African American, while 65% are white. A similar pattern holds for AP.
Public universities retained 85% of white freshmen, but only 66%
of African American freshmen. Non-profit private universities
retained 82% of white freshmen while retaining only
63% of African American freshmen.
Public universities are less likely to retain and advance African American students.4 Public universities retained 85% of white students, but only 66% of African American first-time freshmen and advanced in class status (e.g., accumulated enough credits to move from freshman to sophomore status) 70% of white students and 33% of African American students.
Experience of transfer students is better, but significant gaps remain. Public universities retained 74% of African American transfer students, while retaining 85% of whites and advanced 70% of whites, while advancing only 56% of African Americans.
Non-Profit private universities have retention and advancement gaps. Non-profit private universities retained 82% of white freshmen while retaining only 63% of African Americans. Similarly, these institutions advanced 75% of white freshmen and 46% of African Americans. For transfer students, non-profit private institutions retained 77% of white students and 59% of African Americans, while advancing 65% of white and 45% of African American students.
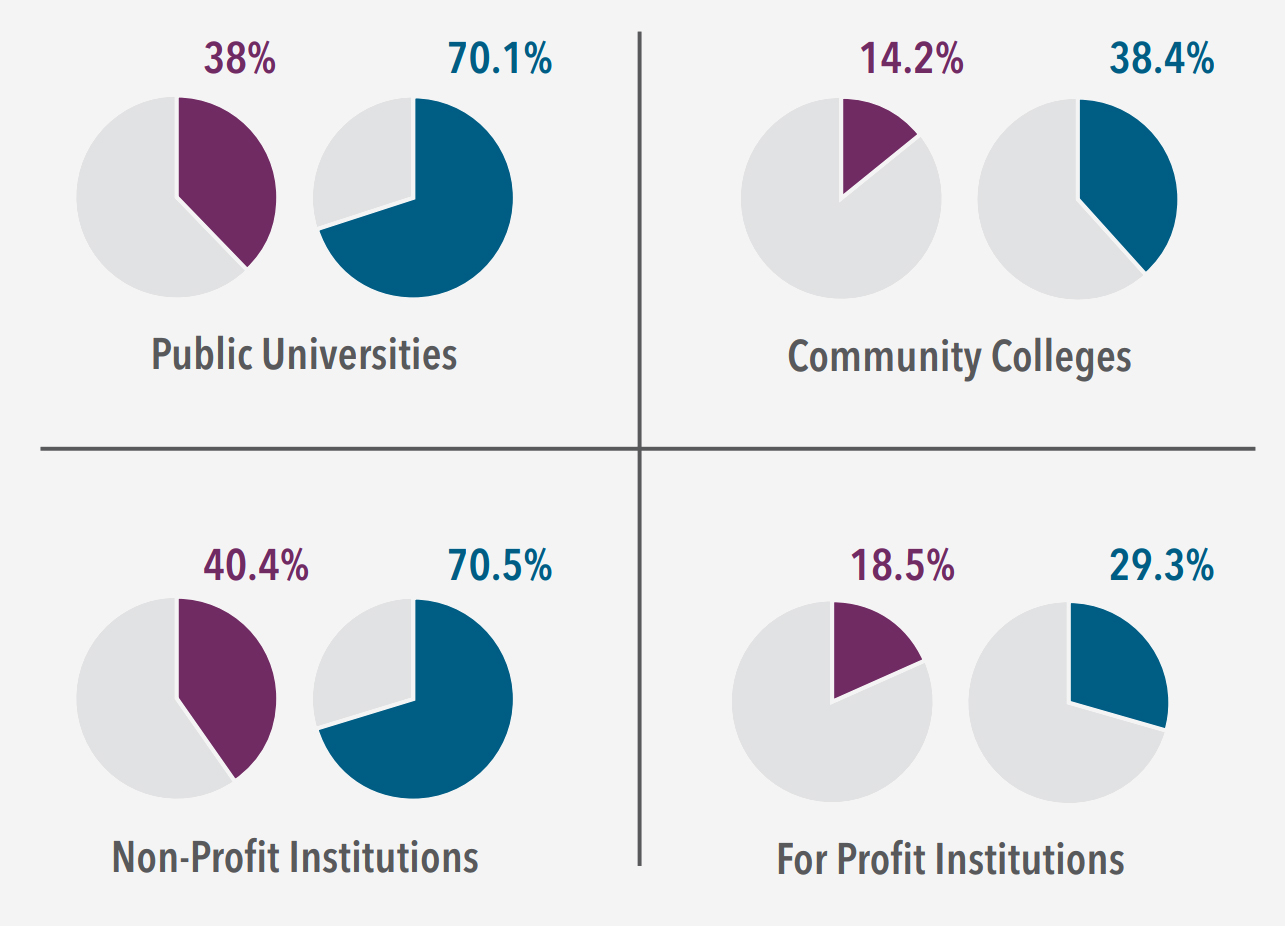
2019 GRADUATION RATES
African American
White

IPEDS Graduation Rates at 150% of Normal Time for students who first enrolled full time. The percent of full-time undergraduate students varies by sector: 88.4% for public universities; 35.4% for community colleges; 91.3% for NFP private colleges; and 41.1% for for-profit private colleges.
All this leads to dramatic and persistent gaps in the rates institutions graduate students. As we look at the percent of first-time, full-time students who complete their degrees within 150% of expected time (e.g., six years for a bachelor’s degree) at the same institution they started, we see significant and persistent gaps in the rates at which institutions in all sectors graduate white compared to African Americans students.