Equity Gaps Facing Low-Income Students
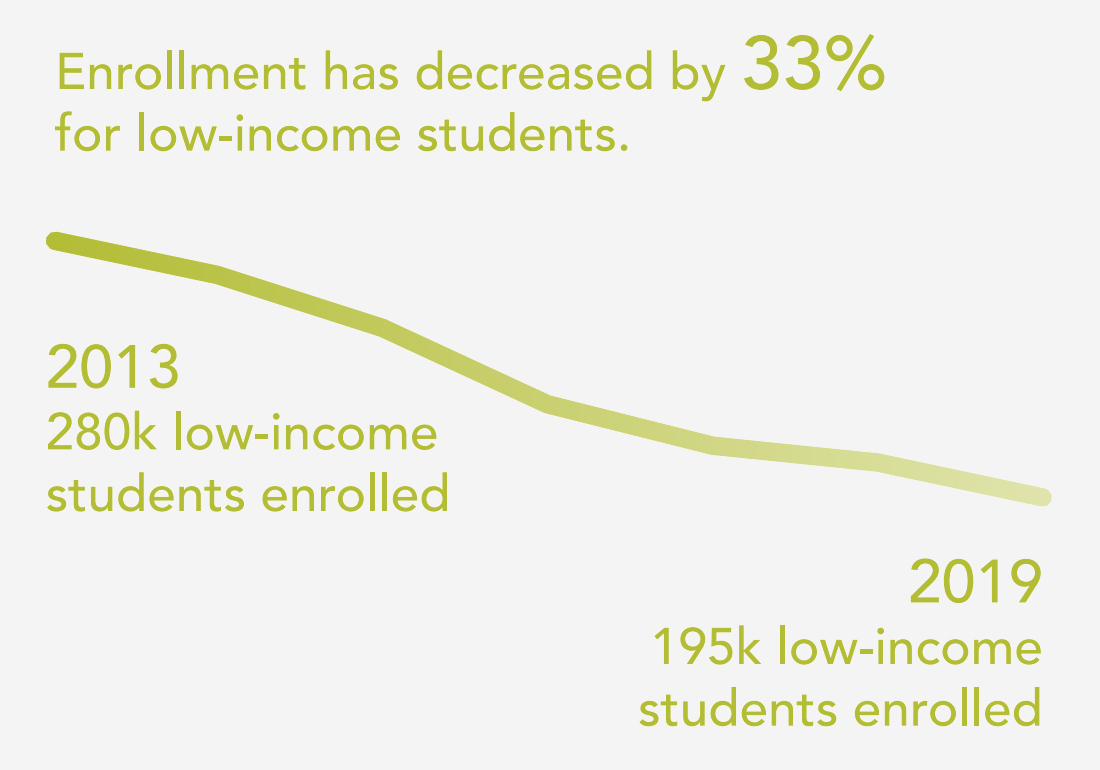
The same patterns of inequity exist for low-income students. About half of the students in the K-12 system come from low-income families, yet low-income students are less likely to go to college: only 53% of low-income Illinois high school graduates go to college within 6 months of graduating, while 74% of non-low-income students do. Between 2013 and 2019, Illinois enrolled over 85,000 fewer low-income undergraduate students, a 32.7% decrease, compared to a 14.9% decrease for non-low-income students.
Low-income students are less likely to have had access to AP and dual credit and more likely to be placed in developmental education. Of recent high school graduates, 41% are from low-income families. However, only 30% of those enrolled in either AP or dual credit were low-income. Low-income students were placed in developmental education at higher rates, with 15% at public universities compared to 5% of non-low-income students, 59% percent compared to 42% at community colleges, 10% compared to 3% at not-for-profit private institutions, and 11.5% compared to 7% at for-profit institutions.
2019 GRADUATION RATES
Pell
Non-Pell
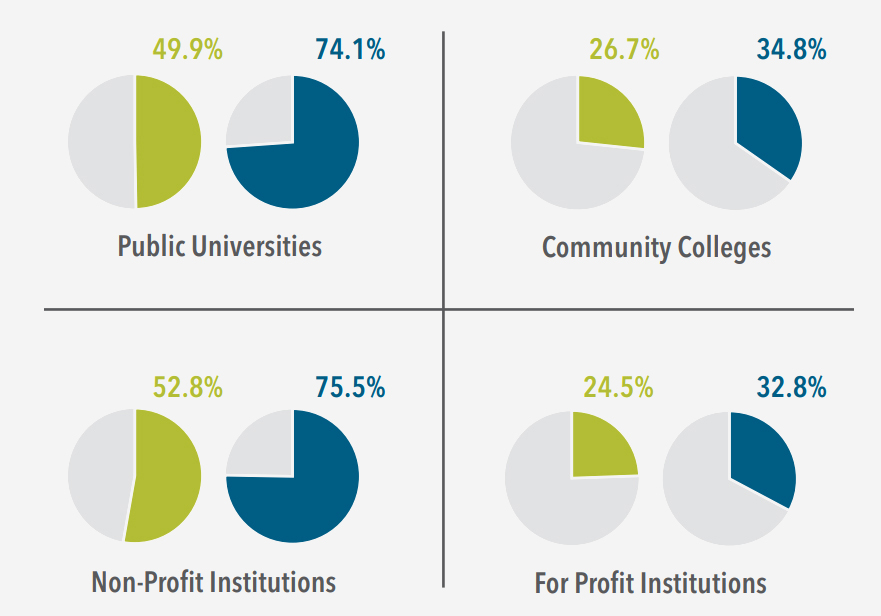
Based on 2016, 2017, 2018, and 2019 IPEDS Graduation Rates at 150% of Normal Time for students who first enrolled full time.
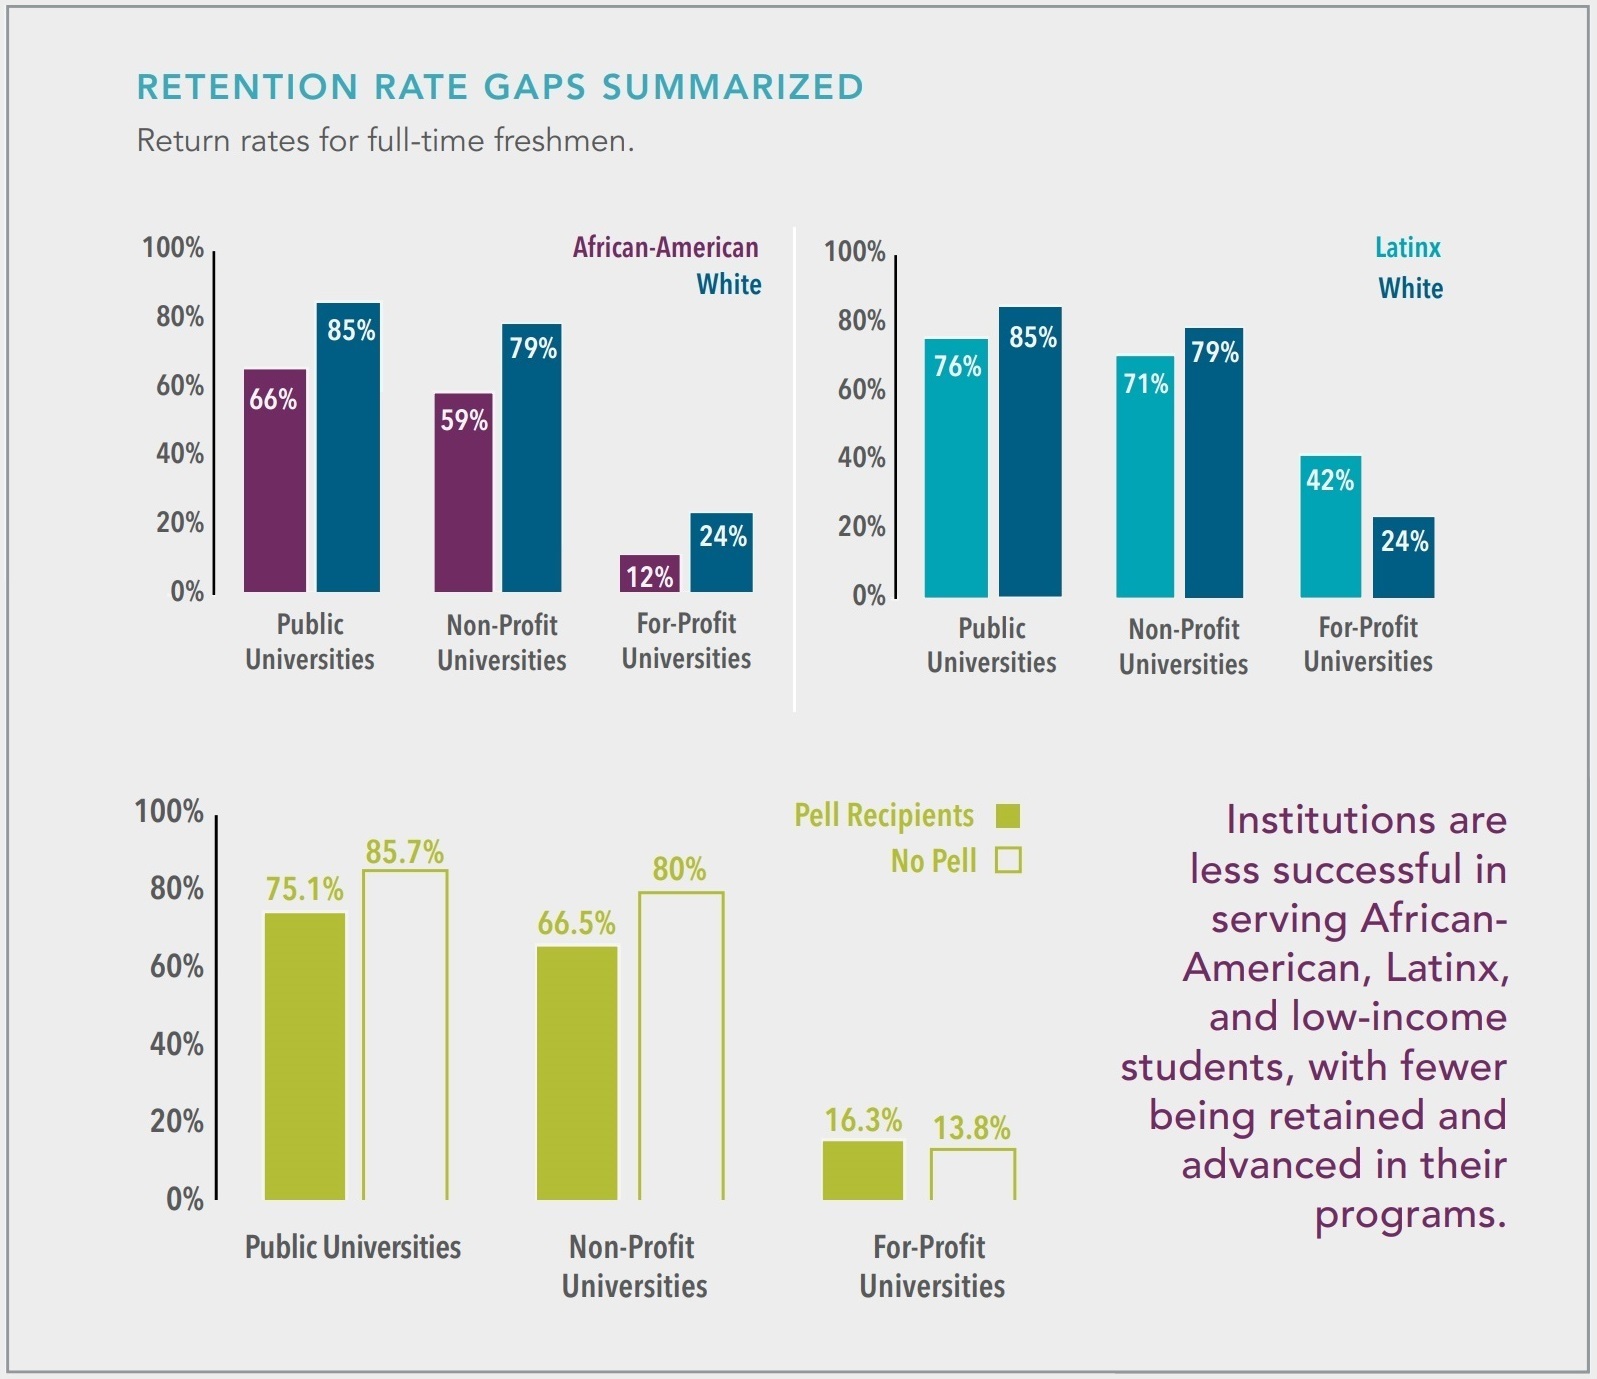
Institutions are less successful in serving low-income students, with fewer being retained and advanced in their programs. As the chart on the next page shows, there is a 10 percentage-point gap in the rate public universities retain low-income and non-low-income students, a nearly 14 percentage point gap at not-for-profit private colleges, and a smaller gap, but much lower retention overall, for for-profit colleges.
Rates of advancement are much lower and the gaps much wider with public universities advancing 71% of non-low-income students and 49% of low-income and the not-for-profit private institutions showing rates of 73% compared to 54% for low-income students.